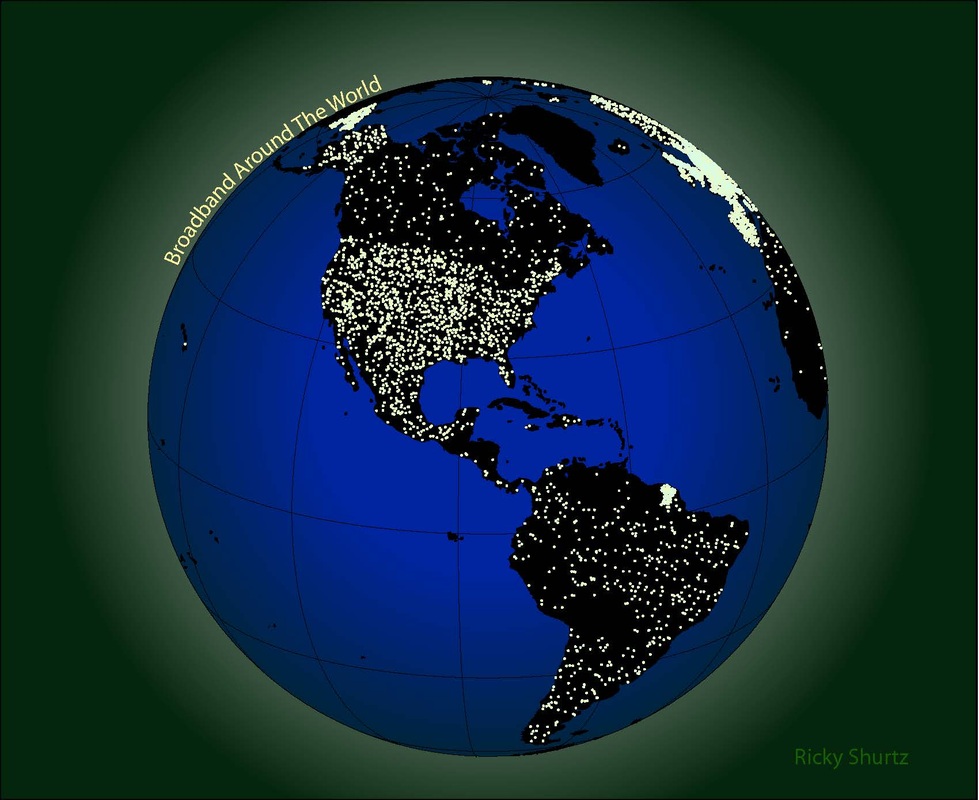
This is my new and improved map, however, I am terrible with Adobe Illustrator so it looks worse then my old one. The old one is shown below.
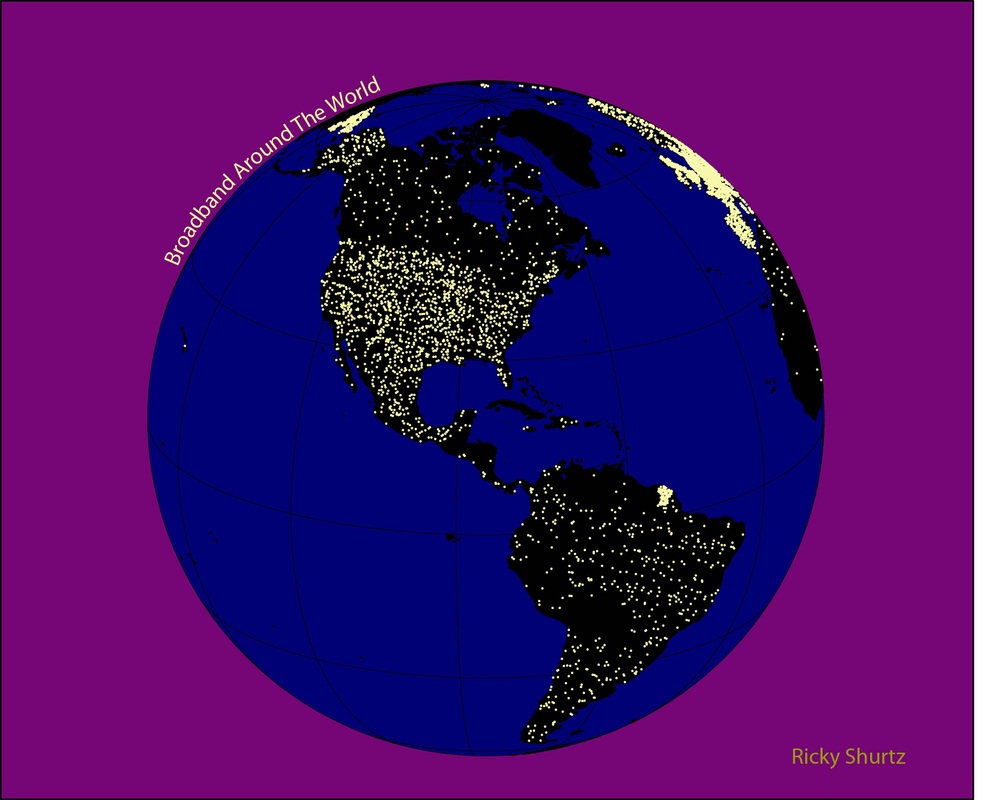
Dot Density Map
The dot density maps are used to show the number items in side the enumeration unit. In this map the enumeration unit was each country. Each dot is placed randomly in the county and represents a given value to the number of broad band users. To create this map I started in ArcMap and under symbology tap and then under quantities chose dot density. Then the art work was done in Adobe Illustrator.